Find data fast and observe quality metrics
User story
Next to data governance, data quality is another core pillar of data management. Good data quality helps make data more useful and usable, resulting in better business outcomes. Meanwhile, bad data quality limits the value of data and results in worse business outcomes. Poor data quality in a source system can, for example, lead to misleading indicators on management dashboards. This can lead to ineffective decision making and a waste of time and resources.
Data quality can be measured in many ways. It is the responsibility of the data governance organisation to define data quality metrics. Data quality is typically measured along the following dimensions:
| Dimension | Description |
|---|---|
| Accuracy | Whether or not the data contains errors. For example, a person’s name should always be correct. |
| Completeness | Whether or not each row of the data has a value. For example, a person should always have a name. |
| Timeliness | Whether or not the data is up to date. For example, the data should only include people currently employed. |
| Uniqueness | Whether or not values that need to be unique, actually are unique. For example, every employee should have a unique ID. |
| Validity | Whether or not the data fits with a predefined format. For example, a person’s initials should always be capitalized. |
For every dimension, one or more data quality rules can be defined. For every rule, a percentage score is calculated by dividing the number of compliant rows over the total number of rows. A score of 100% indicates that the dataset is perfectly compliant with that particular rule.
A lower data quality score for a particular rule indicates that there are data quality issues. The impact and consequences of these issues depends on the characteristics of the dataset.
Typically, manually entered data tends to be of lesser quality than automatically generated data. Improving the data quality of manually entered data, tends to involve the education of people and process improvements. Meanwhile, lower data quality scores for automatically generated data may indicate a bug in the system.
Data quality should be measured at every system where the data is stored, since data transformations can cause data quality to change. If there are data quality issues, these should be solved at the point where the data quality issues are introduced. This is typically at the place where the master data is stored.
Aurelius Atlas allows for the discovery and insight of an organisation’s data quality across data sources. This allows for better business outcomes for users of data. The tool also allows the people responsible for data quality, to do root cause analysis of data quality issues.
The following example demonstrates how data of good quality is discovered by a data engineer. The data engineer is starting up a new analysis and is looking for good quality data to use. Using the Aurelius Atlas tool, the data engineer finds a candidate dataset and reviews the data quality results.
Step by step guide
The data engineer knows the dataset they want to use and goes directly to its details page.
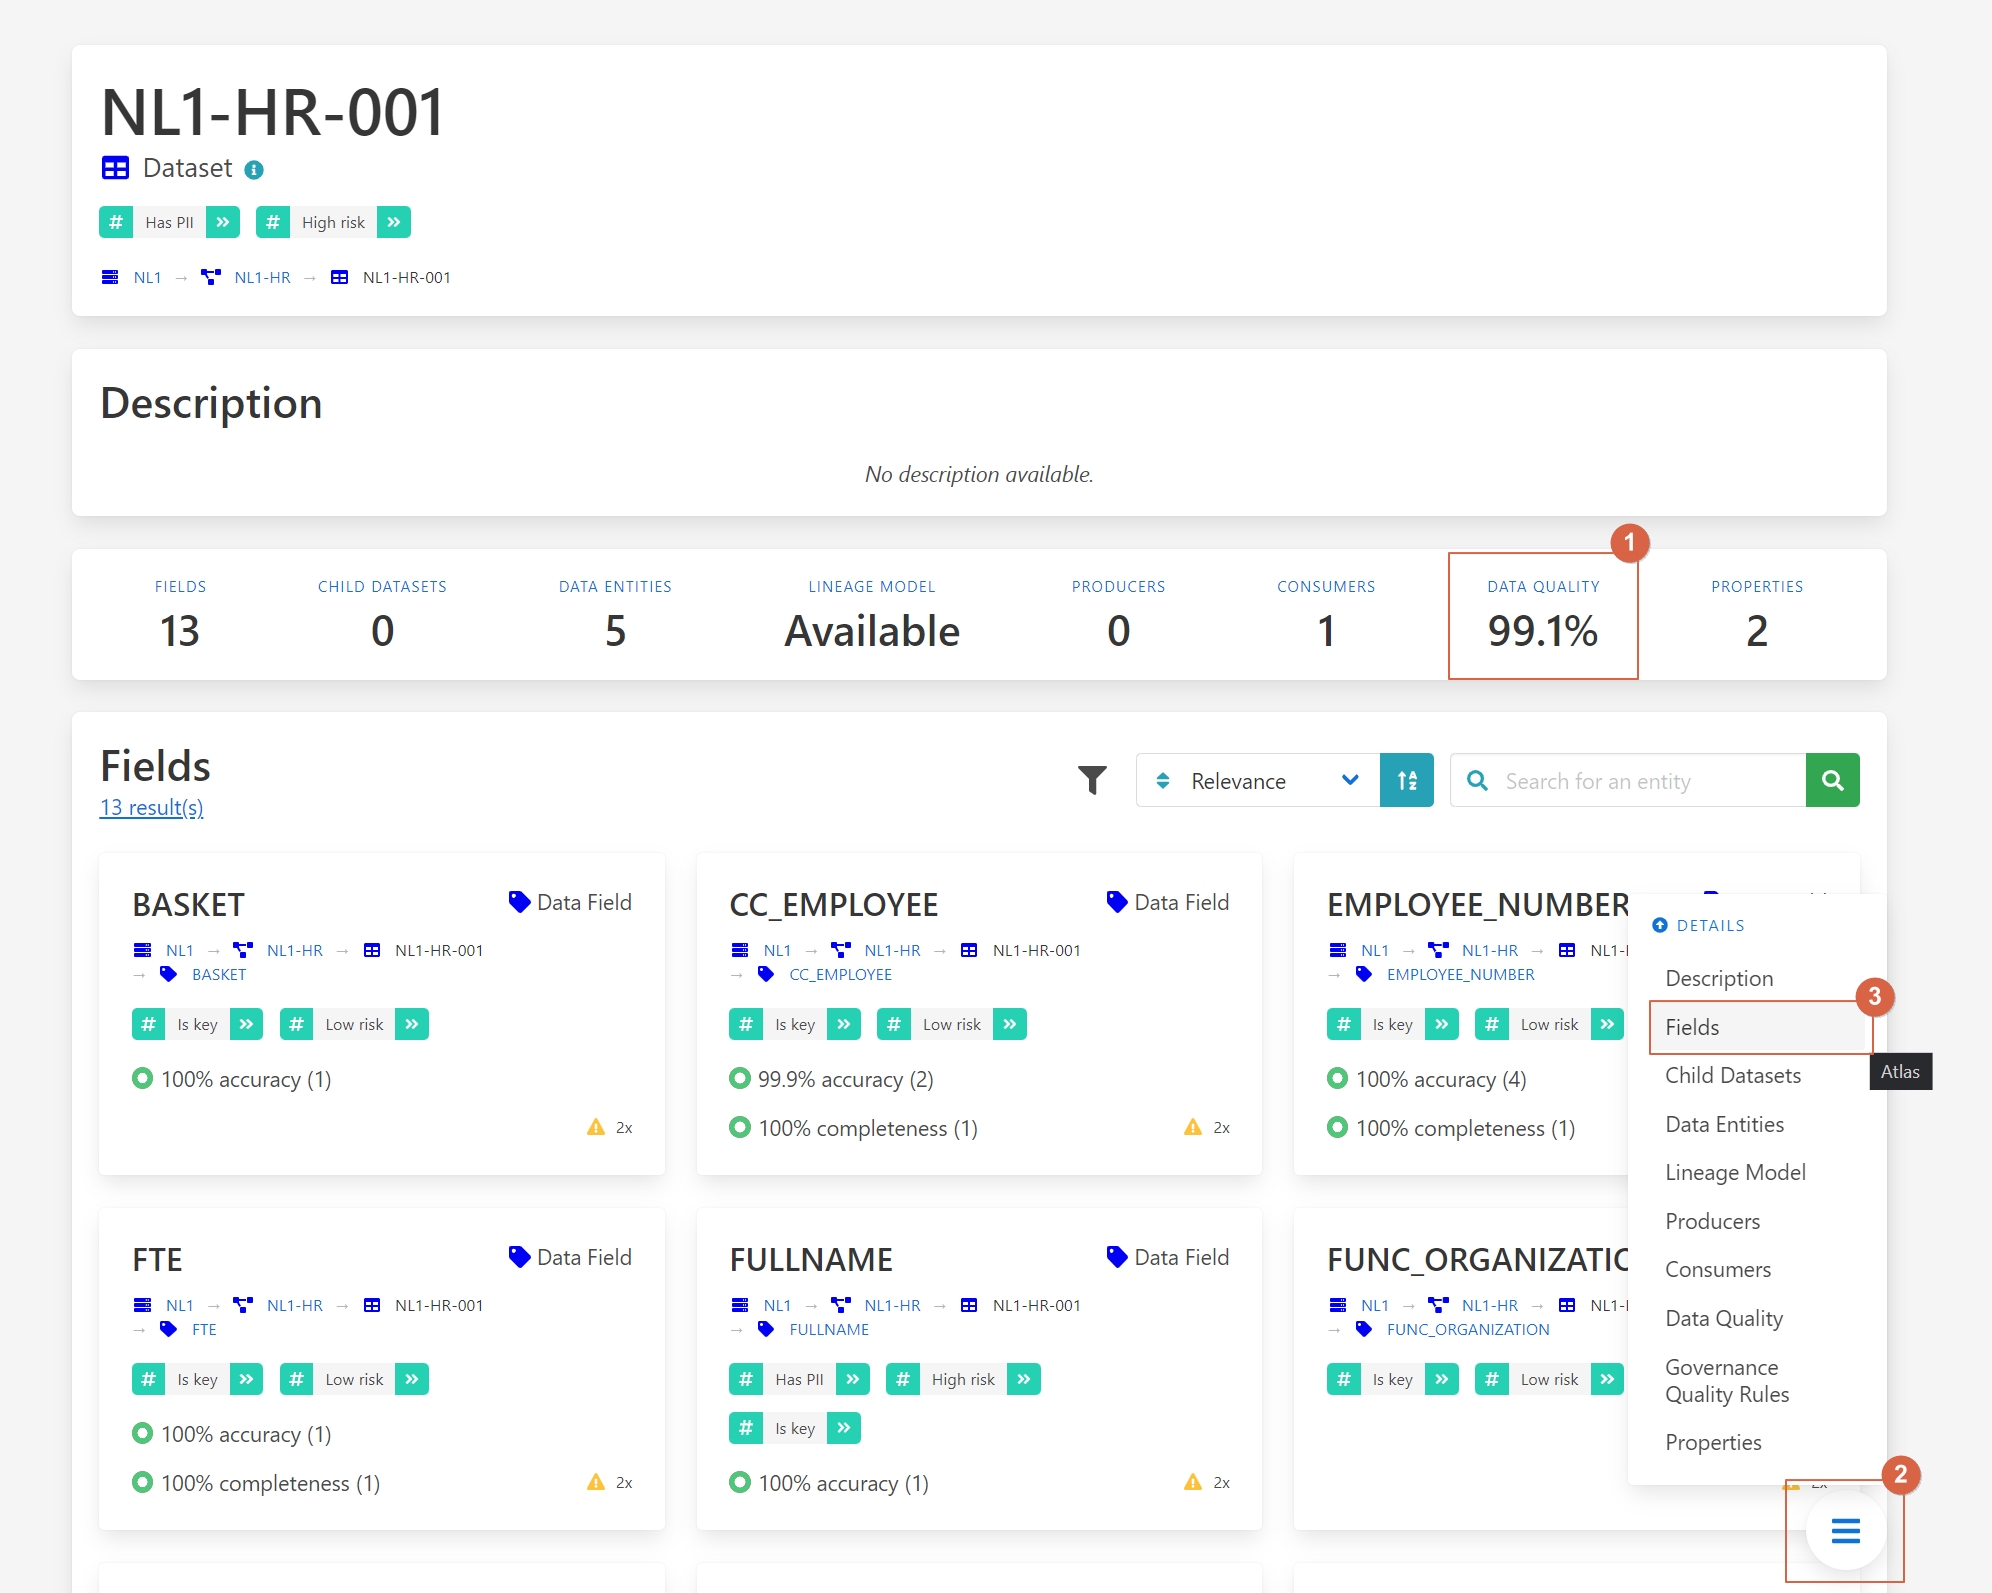
1 - Data quality.
2 – Press on the button.
3 - Select Fields.
Here we can see the quality of each field and identify where the quality is not up to standard.
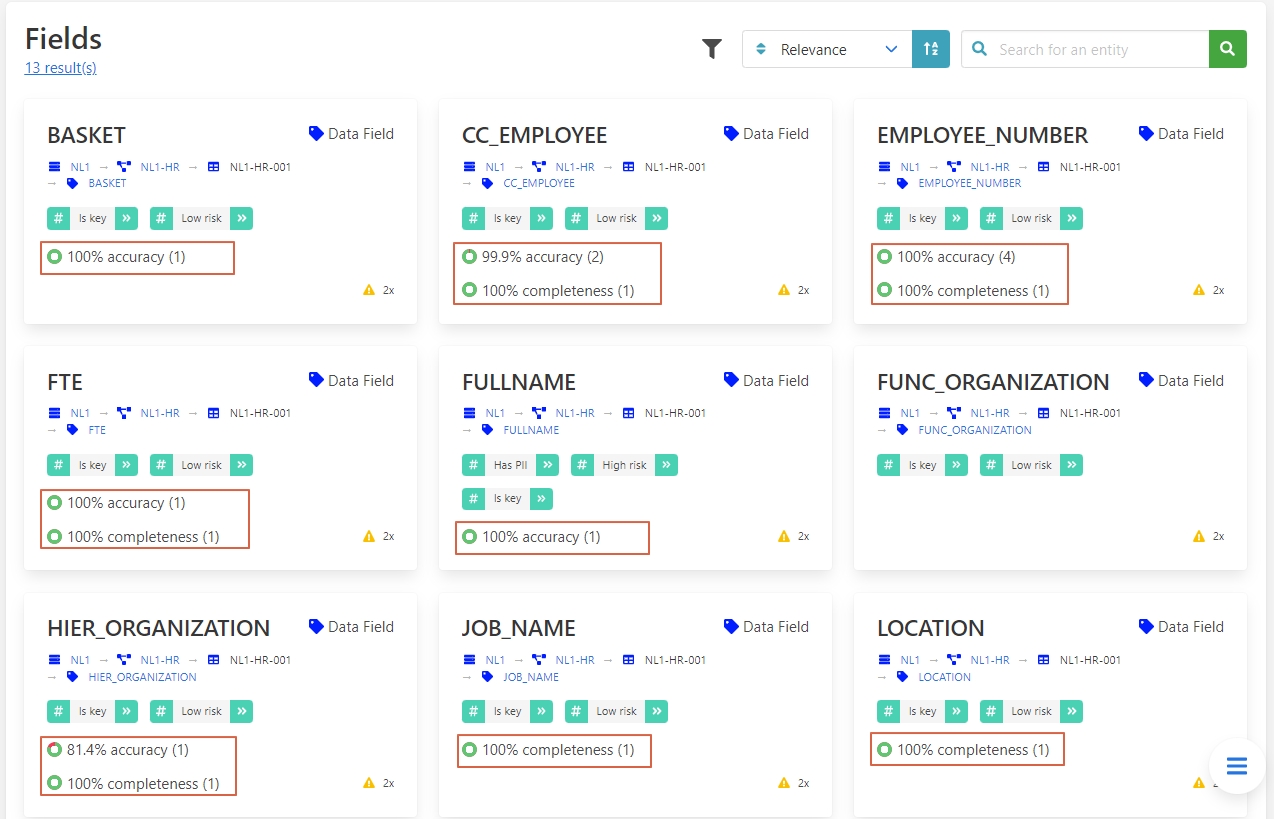
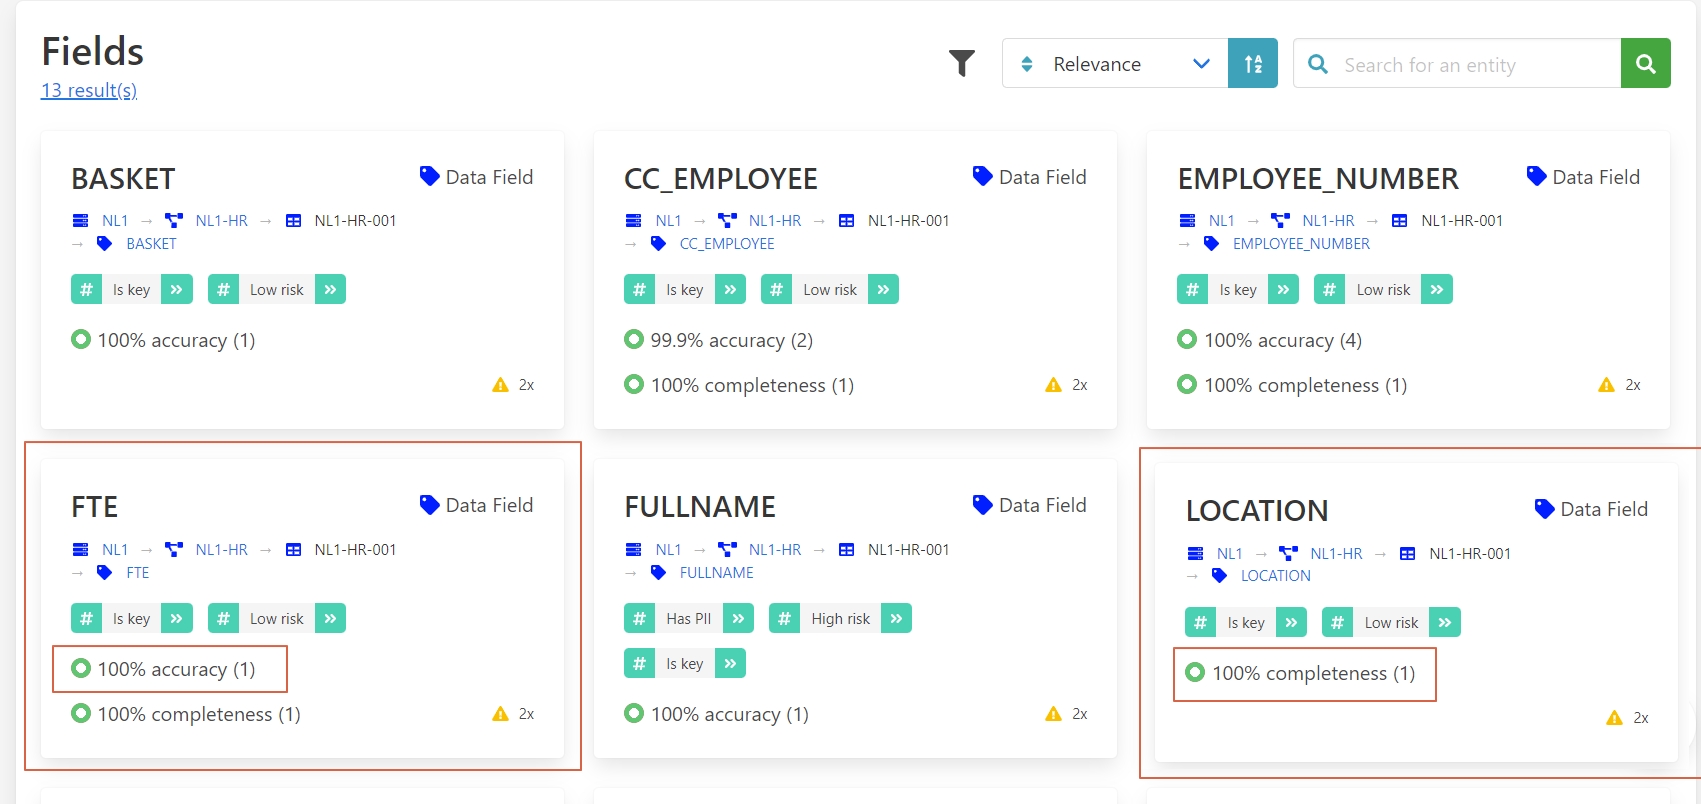
If your project only requires FTE and location fields in which the quality is high, you can ignore the lower quality of the unrelated fields.
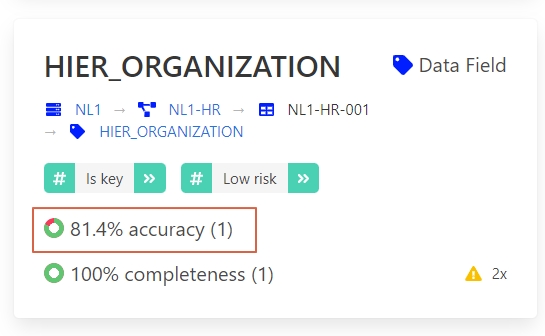
However, if you require the HIER ORGANIZATION field, you can notice that the precision is low.
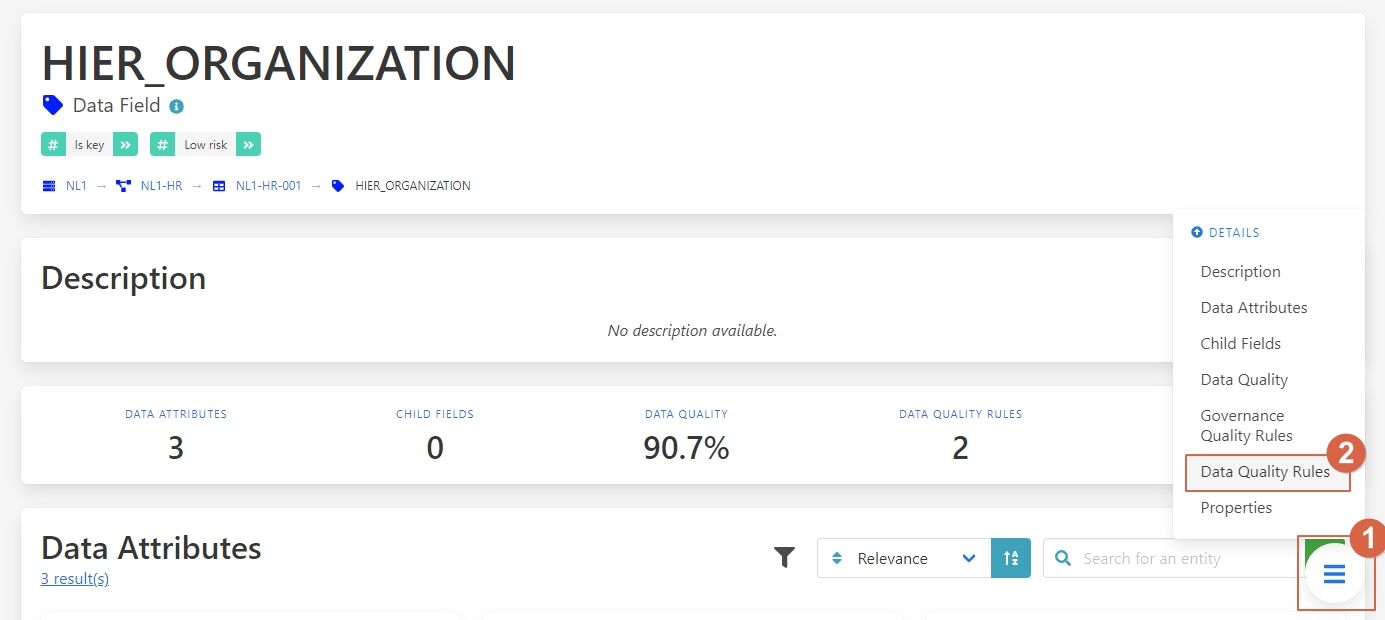
Once on the details page they can navigate to the data quality rules.
Let’s go to the Data Quality Rules
1 - Press on the button.
2 – Select Data Quality Rules.
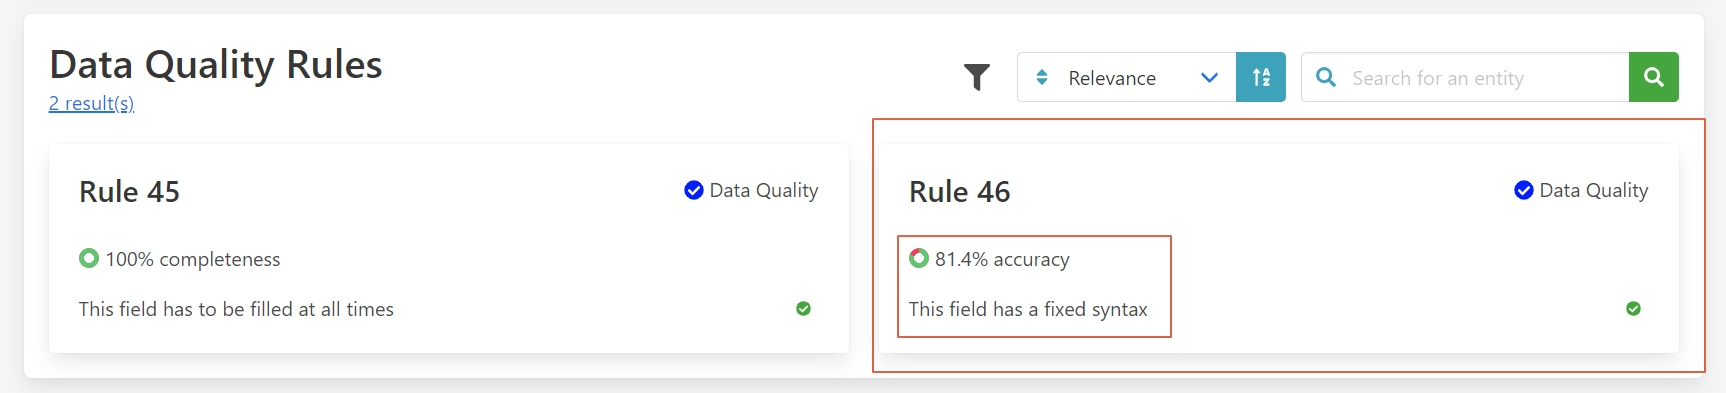
Here all the rules that are applied to this field can be seen, along with their score. It can be seen that the syntax of the field is not always being followed, which resulted in the lower quality score of this field.
With this information, the data engineer can now understand the limitations of the dataset. To understand what this means from a business perspective and to find out who can solve the quality issues, the data engineer can navigate to the data attributes.
Let’s go to the Data Attributes
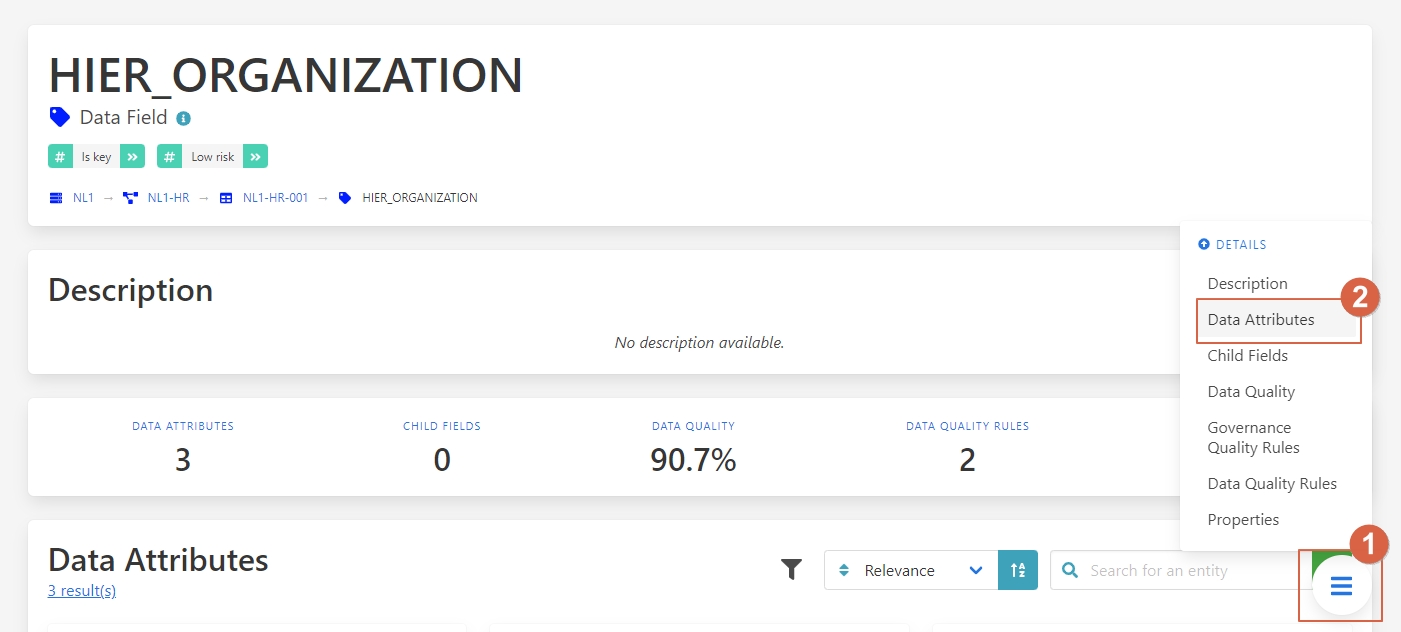
1 - Press on the button.
2 – Select Data Attributes.
As you can see in this picture:
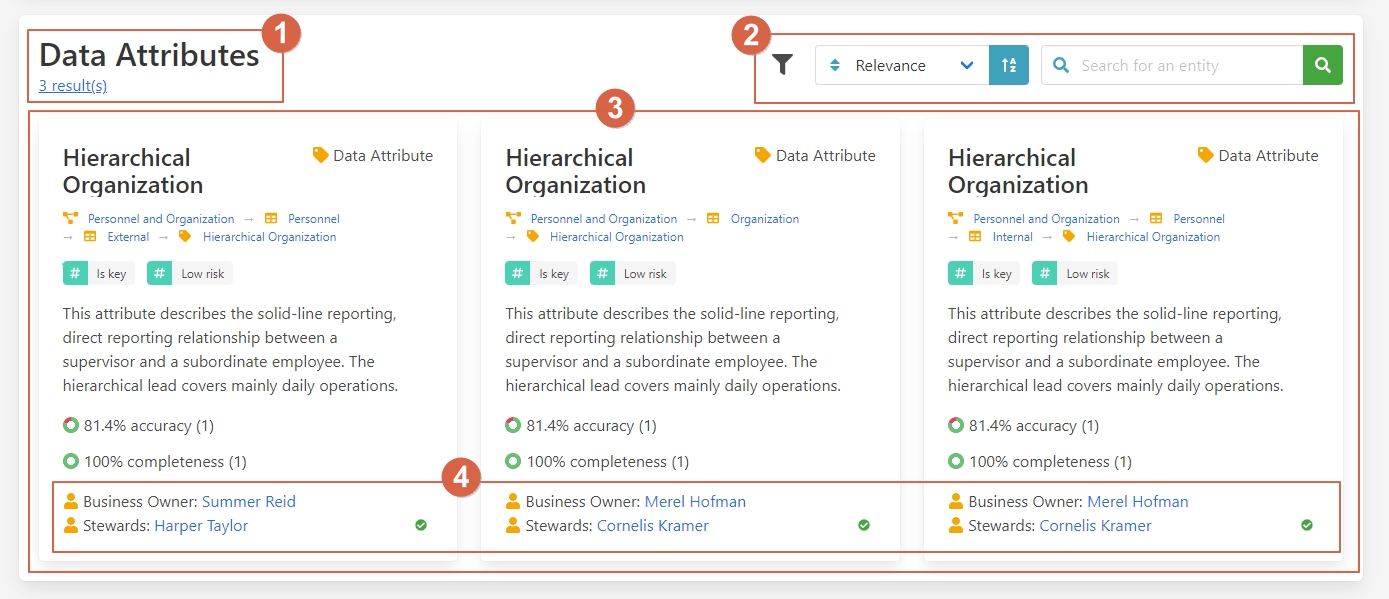
1 - Name and results.
2 - Filter and search bar.
3 - Attributes.
4 - People in charge of this data.
From here the data engineer can now understand what the field means and knows who to contact to improve to the data quality of this field.
This way, your data is always updated and you’re guaranteed better quality, because you can know who oversees it and ask them to clean it up.
Benefits
1 – Great insight into data quality.
2 – Easy to find the person in charge of the data.
3 – Know what quality measures are being applied.